
Real Enterprise Queries. Honest, Verified Results.
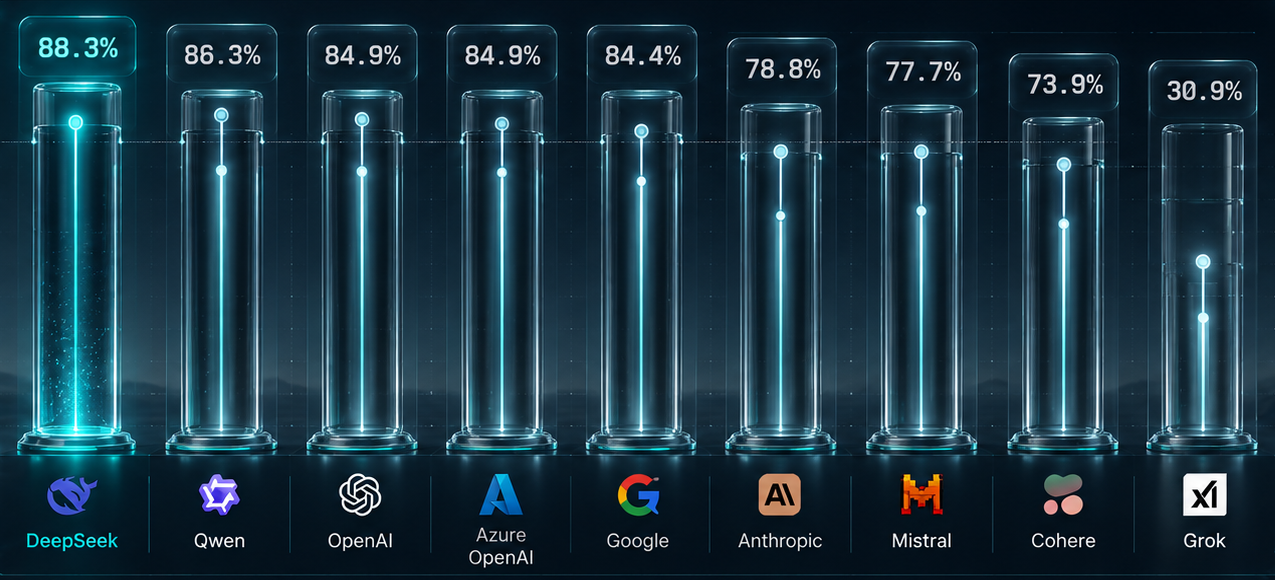
We benchmarked CARDIAC-PURR against 100 real enterprise queries per provider, live, with real spend — not a synthetic easy-classification task. Nine providers were included in this specific benchmark run for testing purposes; the platform itself works with any LLM provider.
Evidence Map
Three Studies. Three Different Questions.
In short: CARDIAC-PURR AI Control Plane has published three separate benchmark studies. A July 12, 2026 study routed 100 real enterprise queries to each of 9 LLM providers, reaching 100% routing accuracy on 8 of 9 providers with savings from 30.9% to 88.3% versus each provider's own most expensive tier. A separate August 12, 2026 study ran 350 requests (50 per framework) across 7 agent frameworks — LangChain, LlamaIndex, AutoGen, CrewAI, Haystack, DSPy, and Semantic Kernel — to confirm the routing layer works through each one. A third, separate September 2026 study measured a 91.2% observed cost reduction on 100 technical queries against a realized LARGE-tier reference. These are three distinct experiments, not one combined metric.
These results come from separate benchmark studies with different workloads, dates, and reference conditions. They measure different things and should not be read as one combined KPI.
| Study | Scope | Primary question |
|---|---|---|
| Enterprise Control Plane | 9 providers × 100 real enterprise queries each · Jul 12, 2026 | How accurately does CARDIAC-PURR route, and what savings result? |
| Agent Framework Benchmark · Exp. 1 | 7 frameworks × 50 requests · 350 total · Aug 12, 2026 | Does the routing layer work through major agent frameworks? |
| Economic Benchmark · Exp. 2 (separate Sep 2026 study) | 100 technical queries · cache bypassed · Sep 2026 · build V120 | What cost reduction was observed versus a realized LARGE-tier reference? |
Methodology
How These Numbers Were Produced.
- 100 queries per provider, across 4 verticals: Legal, Healthcare, Financial, IT (25 per vertical)
- Query mix: 75% simple/definitional, 17% medium/explanatory, 8% complex/open-ended — designed to approximate real support/copilot traffic
- Run date: July 12, 2026
- Measured: routing accuracy — did the query go to the tier (small/medium/large) a human pre-labeled as correct for that query's complexity?
- Savings computed from real per-query dollar costs against what the same queries would have cost at that provider's most expensive tier
Run: Jul 12, 2026 · Scope: 9 providers · 100 queries/provider · Real API spend
Results
9 Providers — Routing Accuracy & Savings.
| Provider | Routing Accuracy | Errors | Verified Savings vs. Always-Large |
|---|---|---|---|
| DeepSeek | 100% | 0/100 | 88.3% |
| Qwen | 100% | 0/100 | 86.3% |
| OpenAI | 100% | 0/100 | 84.9% |
| Azure OpenAI | 100% | 0/100 | 84.9% |
| 100% | 0/100 | 84.4% | |
| Anthropic | 100% | 0/100 | 78.8% |
| Mistral | 100% | 0/100 | 77.7% |
| Cohere | 98.0% | 2/100 | 73.9% |
| Grok | 100% | 0/100 | 30.9% |
DeepSeek (88.3% — highest)
DeepSeek's small and medium tiers call the same model, which is dramatically cheaper than its large tier — 92% of traffic in this benchmark never touches the expensive model at all.
Grok (30.9% — lowest)
All three of Grok's tiers currently call the same underlying model, differentiated only by a compute-effort setting rather than a genuinely cheaper model. Every other provider saves money by routing easy queries to a smaller model; Grok doesn't offer that today. This is an honest ceiling given how Grok is currently offered, not a routing weakness.
Cohere (73.9% savings, 98.0% accuracy)
Cohere prices its medium and large tiers identically, capping its best-case savings regardless of routing quality. Its 98.0% accuracy reflects two provider-side read timeouts, not routing misclassification — the router selected the correct tier both times; the provider's API failed to respond in time.
Why the savings figures vary so much:
Savings percentage isn't a router-quality score — it's a function of how far apart each provider prices its own tiers. Routing accuracy is the fair way to judge the router itself; on that measure, 8 of 9 providers hit 100%.
How to Read the Results
Accuracy. Savings. Latency.
Routing Accuracy
Did CARDIAC-PURR send the query to the tier a human pre-labelled as appropriate for its complexity? This measures routing, not factual answer correctness.
Cost Reduction
How much lower was the observed model inference cost than the defined reference condition? Savings depend partly on how each provider prices its small, medium, and large tiers.
End-to-End Latency
How long did the request take from the application's perspective? This includes routing and provider response time — it is not the same as router execution time alone.
Latency
Routing Overhead & End-to-End Latency.
Routing Decision (pre-inference)
This is what CARDIAC-PURR AI Control Plane itself adds, measured in isolation: sub-millisecond (p50 0.42ms, p99 0.97ms). Pure in-process computation, no I/O.
Per-Provider Proxy Overhead
| Provider | Overhead |
|---|---|
| DeepSeek | 12.7ms |
| Azure OpenAI | 12.8ms |
| Grok | 13.3ms |
| Qwen | 13.8ms |
| 14.4ms | |
| OpenAI | 14.8ms |
| Anthropic | 14.9ms |
| Mistral | 15.2ms |
| Cohere | 558.9ms |
Cohere's overhead is confirmed elevated across separate test runs — a genuine characteristic of that integration, not a one-off measurement artifact.
End-to-End Latency (routing + provider response)
This reflects each provider's own response time, not CARDIAC-PURR's routing overhead.
| Provider | P50 | P95 | P99 |
|---|---|---|---|
| 0.77s | 5.38s | 6.22s | |
| Mistral | 0.77s | 4.00s | 5.90s |
| OpenAI | 0.81s | 2.86s | 3.59s |
| Qwen | 0.86s | 4.20s | 5.03s |
| Grok | 1.07s | 6.97s | 9.34s |
| Azure OpenAI | 1.16s | 2.40s | 3.30s |
| Anthropic | 1.81s | 25.54s | 48.36s |
| DeepSeek | 1.96s | 9.04s | 21.75s |
| Cohere | 3.84s | 11.25s | 16.27s |
Agentic Framework
Agentic Framework Benchmark — August 12, 2026.
A separate, smaller-scope benchmark of agent-framework routing — 350 factual-QA requests across 7 frameworks, all routed to the small tier. This is distinct from the 9-provider AI Control Plane benchmark above.
100%
Accuracy on this 350-request factual-QA workload, small tier
80%
Savings on this same factual-QA workload
Frameworks tested: LangChain, LlamaIndex, AutoGen, CrewAI, Haystack, DSPy, Semantic Kernel — 50 requests each, 350 total, Anthropic claude-haiku-4-5-20251001, small tier.
These figures apply only to this factual-QA workload at small-tier routing — not a general accuracy or savings claim, and medium/large tiers were not exercised by this run. Caching affected the workload and is disclosed here rather than omitted. Results are reported as an aggregate across all 7 frameworks combined; no per-framework breakdown is published from this run.
Full architecture, framework integration paths, and routing detail are documented separately.
Run: Aug 12, 2026 · Scope: 7 frameworks · 350 requests · Small tier, Claude Haiku 4.5 · Cache present
Scope
What This Measures, and What It Doesn't.
This is one benchmark run against a query mix designed to approximate real enterprise traffic — a reasonable pilot, not a claim of production-scale robustness across every workload. If you're evaluating this for your own traffic, run your own workload through it rather than take this number as a universal guarantee.
Full per-query results are available on request.
Evidence Coverage
What We Have Tested. What We Haven't.
Verified
9-provider enterprise routing benchmark · 7-framework compatibility benchmark (350 requests) · capability-aware tier-upgrade validation (3 controlled checks) · semantic caching · real provider API execution · routing accuracy · provider-level cost comparisons.
Not Yet Benchmark-Verified
Multi-step autonomous agent workflows, multi-agent orchestration, actual tool-execution success, structured-output evaluation, multimodal routing, and streaming behavior.
Benchmark Timeline
Evidence Across Three Runs.
JUL 12, 2026
Enterprise Control Plane
9 providers · 100 real enterprise queries per provider
AUG 12, 2026
Agent Framework · Experiment 1
7 frameworks · 350 factual-QA requests
SEP 2026
Economic Benchmark · Experiment 2
100 technical queries · cache bypassed · build V120
Run: Sep 2026 · Build V120 · Scope: 100 technical queries · Cache bypassed · vs realized LARGE-tier reference
FAQ
Common Questions.
Why does Cohere's latency look so different from the other providers?
Cohere's routing overhead (558.9ms) is meaningfully higher than the other 8 providers (12.7–15.2ms), confirmed across separate test runs — a genuine characteristic of that integration, not a measurement error.
Why was Azure tested but folded into the OpenAI row for cost data?
Azure OpenAI runs the same underlying models as OpenAI.
Does this mean CARDIAC-PURR AI Control Plane only works with these 9 providers?
No. These 9 were used for this specific benchmark run. The platform itself works with any LLM provider — see Platform for how routing and governance work regardless of which provider you use.
Can I see the full per-query data?
Yes, available on request — full methodology and per-item results are provided under standard technical documentation request.
Why does Grok show such a lower savings figure (30.9%) than the rest?
The 30.9% figure is reported deliberately, alongside the higher-performing providers, because this benchmark is presented as honest results including where the platform underperformed — not a curated best-case number. It reflects that specific provider's characteristics on this specific 100-query, 4-vertical test run, not a universal ceiling.
What counts as "Accuracy" in the results table — routing accuracy or response correctness?
Routing accuracy, specifically: whether the query went to the tier (small/medium/large) a human pre-labelled as correct for that query's complexity — see Methodology above. It is not a measure of whether the underlying model's answer was factually correct.
Are these real enterprise queries or synthetic test data?
Real: 100 real enterprise queries per provider, run live with real spend against each provider's actual API — not a synthetic, easy-classification task built to flatter the result.
Are the savings percentages based on public list price, or negotiated/volume pricing?
Savings are computed from real per-query dollar costs against what the same queries would have cost at that provider's own most expensive tier — i.e., standard published pricing, not a customer-specific negotiated or volume-discounted rate. If you have your own negotiated provider pricing, your actual savings may differ from the published figures.
What's the confidence interval on these numbers, and how is it calculated?
95% confidence intervals using the Wilson score method (standard statistical practice for proportions), documented in enterprise_benchmark.py. The benchmark is re-run multiple times per month; the results above are from the July 12, 2026 run.
Which providers were excluded from this run, and why?
Not excluded so much as out of scope for this specific run: this benchmark covered 9 providers (DeepSeek, Qwen, OpenAI, Azure OpenAI, Google, Anthropic, Mistral, Cohere, Grok). Other supported providers, including Llama and Custom endpoints, weren't part of this particular test — see Platform for the full supported-provider list.
Will these numbers hold for our own traffic?
Not necessarily as a guarantee — these results reflect 100 real enterprise queries per provider across Legal, Healthcare, Financial, and IT verticals. If you're evaluating this for your own workload, running your own traffic through it is the recommended way to validate savings for your specific mix of tasks.
How often is this benchmark re-run?
Multiple times per month. This run reflects the latest results, from July 12, 2026.
Are the 80%, 88.3%, and 91.2% figures measuring the same thing?
No. They come from different studies with different workloads and reference conditions. The 9-provider benchmark reports provider-specific savings against each provider's own most expensive tier (Jul 12, 2026); the 80% figure comes from the August 12, 2026 seven-framework benchmark; and 91.2% comes from the separate September 2026 economic benchmark, measured against a realized LARGE-tier reference arm.
Does 91.2% mean 91.2% routing accuracy?
No. 91.2% is an observed cost-reduction result from the separate September 2026 economic benchmark. Routing accuracy is a different metric, reported on the primary 9-provider benchmark above.
How is the Agent Framework Benchmark different from this benchmark?
The Agent Framework Benchmark tested seven frameworks through the CARDIAC-PURR OpenAI-compatible endpoint on a 350-request factual-QA workload. This primary benchmark tests provider routing across nine providers using 100 real enterprise queries per provider. The two studies answer different questions and shouldn't be treated as one combined experiment.
Does the 350-request framework benchmark test multi-step agents?
No. It used single-turn factual-QA tasks. Multi-step agentic workflows, multi-agent orchestration, and actual tool execution were not evaluated in that benchmark — see Agentic Framework for what has and hasn't been tested.
Did you measure answer quality and economic savings on the same cohort?
Not as a single combined result. The published studies measure different dimensions on different workloads, so the cost figures should not be read as an answer-quality result.
Can the published benchmark results be reproduced?
Each study's methodology identifies the workload, provider or framework, run date, reference condition, routing metric, and cost calculation. Full per-query results for the primary benchmark are available on request, and benchmark runs are repeated periodically.